
Visible Learning
John Hattie of the University of Melbourne, Australia, has long researched performance indicators and evaluation in education. His research, Visible Learning, is the culmination of more than 25 years of examining and synthesizing more than 1,600 meta-analyses comprising more than 95,000 studies involving 300 million students around the world.
Hattie wanted to understand which variables were the most important. Although “almost everything we do improves learning,” why not prioritize the ones that will have the greatest effect?
Hattie set about calculating a score or “effect size” for each, according to its bearing on student learning and taking into account such aspects as its cost to implement. The average effect size was 0.4, a marker that represented a year’s growth per year of schooling for a student. Anything above 0.4 would have a greater positive effect on student learning.
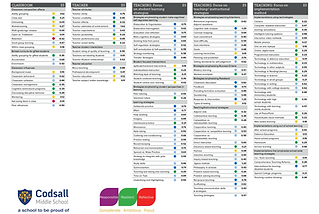
To understand what the 250+ influences on Student Achievement are, simply 'click' on the images below. They are colour coded
Dark Blue - Potential to considerably accelerate Student Achievement
Light Blue - Potential to accelerate Student Achievement
Green - Likely to have a positive impact on Student Achievement
Yellow - Likely to have a small positive impact on Student Achievement
Red - Likely to have a negative impact on Student Achievement
.png)
_JPG.jpg)

